

Analytics
Analytics & Reporting
Get actionable insights with real-time dashboards and customizable reports.
- Plans from $150/user/year
- Cancel anytime
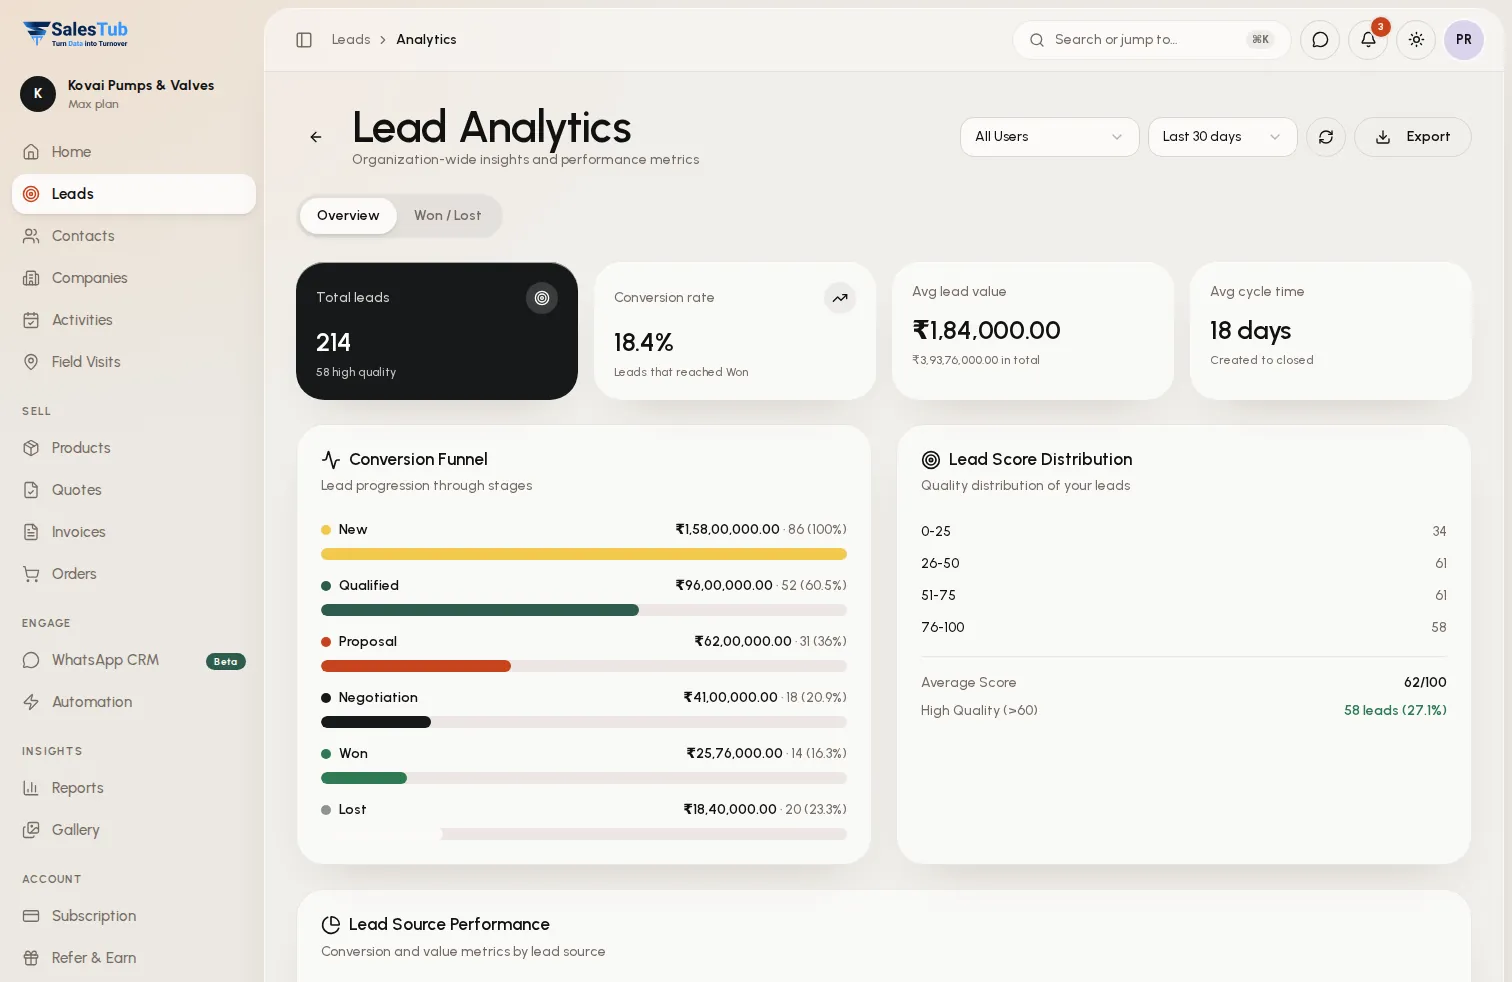
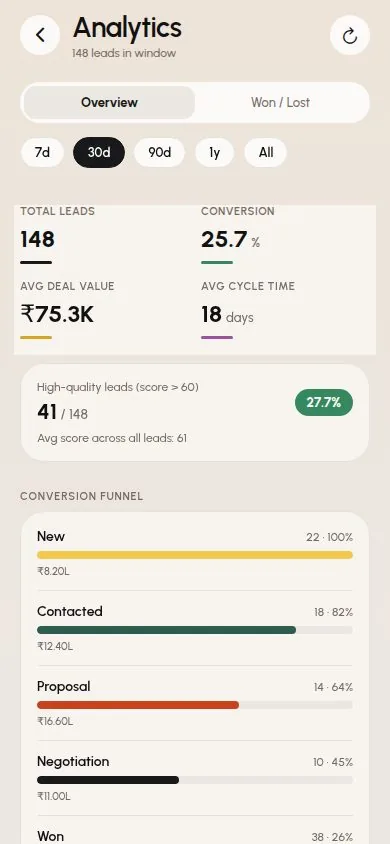
- Real-Time
- Dashboards
- Custom
- Reports
- AI
- Forecasting
Overview
What is Analytics & Reporting in SalesTub?
Stop guessing, start knowing. SalesTub's analytics and reporting give you real-time visibility into every aspect of your sales operation. Build custom dashboards that show what matters most. Create reports that answer your specific questions. Forecast revenue accurately. Track team performance. Identify bottlenecks and optimize your sales process with data.
- Real-time dashboards with live data updates
- Drag-and-drop custom report builder
- Scheduled reports via email delivery
- AI-powered sales forecasting
- Pipeline conversion and velocity analytics
- Team and individual performance metrics
- Win/loss analysis with trend tracking
- Export to PDF, Excel, and CSV formats
- Goal tracking with progress visualization
How it works
Up and running in 3 steps
- 1
Build Dashboards
Drag and drop charts, tables, and KPI widgets. Choose data sources, filters, and visualization types. Save and share dashboards with your team.
- 2
Create Reports
Select modules and fields to report on. Add filters, grouping, and sorting. Save report definitions for recurring use.
- 3
Schedule & Share
Set up automatic report delivery via email. Choose daily, weekly, or monthly schedules. Share dashboards with specific teams or roles.
Use cases
Built for how you sell
Whether you sell to businesses or consumers, at a counter or in the field, SalesTub adapts to your process — not the other way round.
Sales Leaders
Monitor pipeline health, forecast revenue, and identify deals at risk. Track team performance and coaching opportunities with clear metrics.
Sales Operations
Analyze conversion rates by stage, source, and rep. Identify process bottlenecks. Measure the impact of changes to the sales process.
Executive Teams
Get high-level business dashboards with revenue trends, growth metrics, and forecast accuracy. Make strategic decisions with confidence.
Individual Reps
Track your own pipeline, activities, and quota attainment. See where you stand and what you need to do to hit your targets.
For the whole team
One tool, every role
Business owners
See exactly where revenue comes from, which channels convert and what will close this month.
Sales managers
Assign leads instantly, watch team activity live and make sure no follow-up is ever missed.
Sales reps
Less data entry, more selling — every lead, call and message in one place, on web and mobile.
Works with
Connected to the tools you already use
- Google Data Studio
- Power BI
- Tableau
- Excel Export
- PDF Reports
- Email Delivery
- API Access
- Webhooks
FAQ
Analytics & Reporting: questions
Can I build custom dashboards?
Yes! Drag and drop to create dashboards with charts, tables, KPI cards, and more. Each user can have their own personalized dashboard or share team dashboards.
How does sales forecasting work?
Forecasting uses deal stages, close dates, and historical win rates to predict future revenue. AI-assisted forecasting improves accuracy over time based on your data patterns.
Can reports be scheduled?
Yes. Schedule any report to be emailed daily, weekly, or monthly. Recipients get the report automatically without needing to log in.
What visualization types are available?
Bar charts, line charts, pie charts, donut charts, funnel charts, tables, KPI cards, gauges, and more. Choose the right visualization for your data.
Can I report on custom fields?
Absolutely. Custom fields are fully available in the report builder. Filter, group, and summarize by any custom field you've created.
How far back can I see historical data?
All historical data is retained and reportable. Compare this month to last year. Track long-term trends. No data is ever deleted from your account.
Explore more of SalesTub
All featuresContact Management
Organize and manage all your customer relationships in one central hub with powerful search and filtering.
Lead Management
Capture, qualify, and convert leads faster with automated lead scoring and intelligent routing.
WhatsApp CRM
A shared WhatsApp inbox linked to every lead, with approved templates, broadcast campaigns and a chatbot.
Put Analytics & Reporting to work today.
Get started in minutes. Cancel anytime. No long-term contracts.
- Setup in 5 minutes
- No long-term contracts
- Cancel anytime
Or take SalesTub with you